
From data representation to data storytelling
Olivier Aubert - www.olivieraubert.net
Cinepoietics fellowship - 02/2020
Scholarship active reading
Scholarship active reading - representation
Data representation
From a data-science point-of-view, data representation/visualization:
- is used to support research process
- is used to support publication/communication
- requires appropriate data modelling
General process
- data modelling
- data input/extraction
- data visualization/representation
- visualization interaction
- data storytelling
Modelling
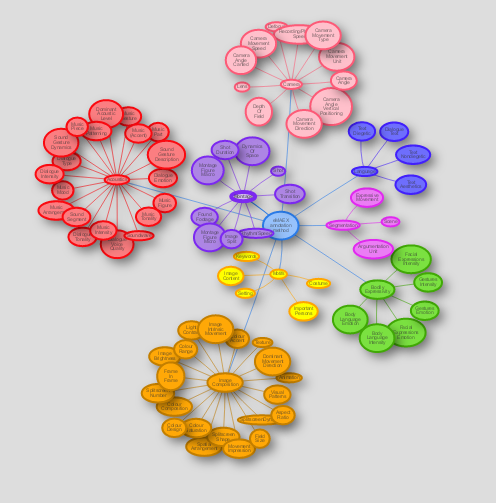
AdA ontology model
Data input
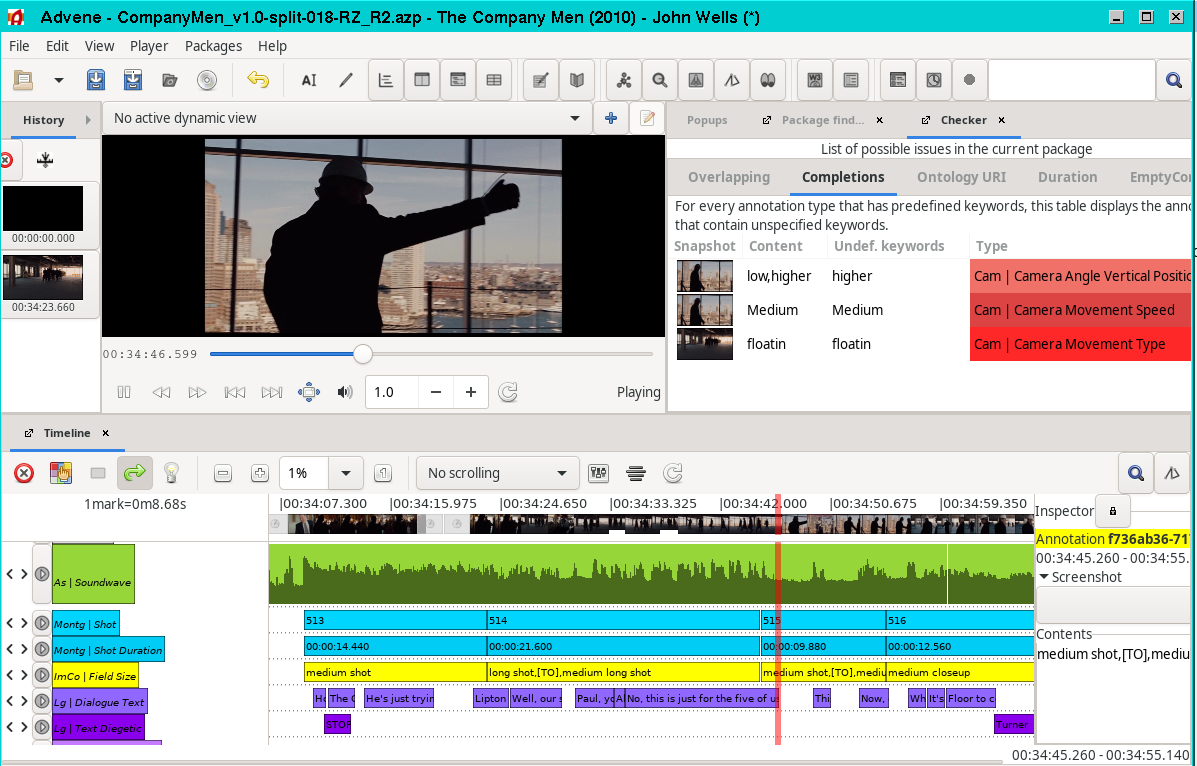
Annotating with Advene
Data visualization
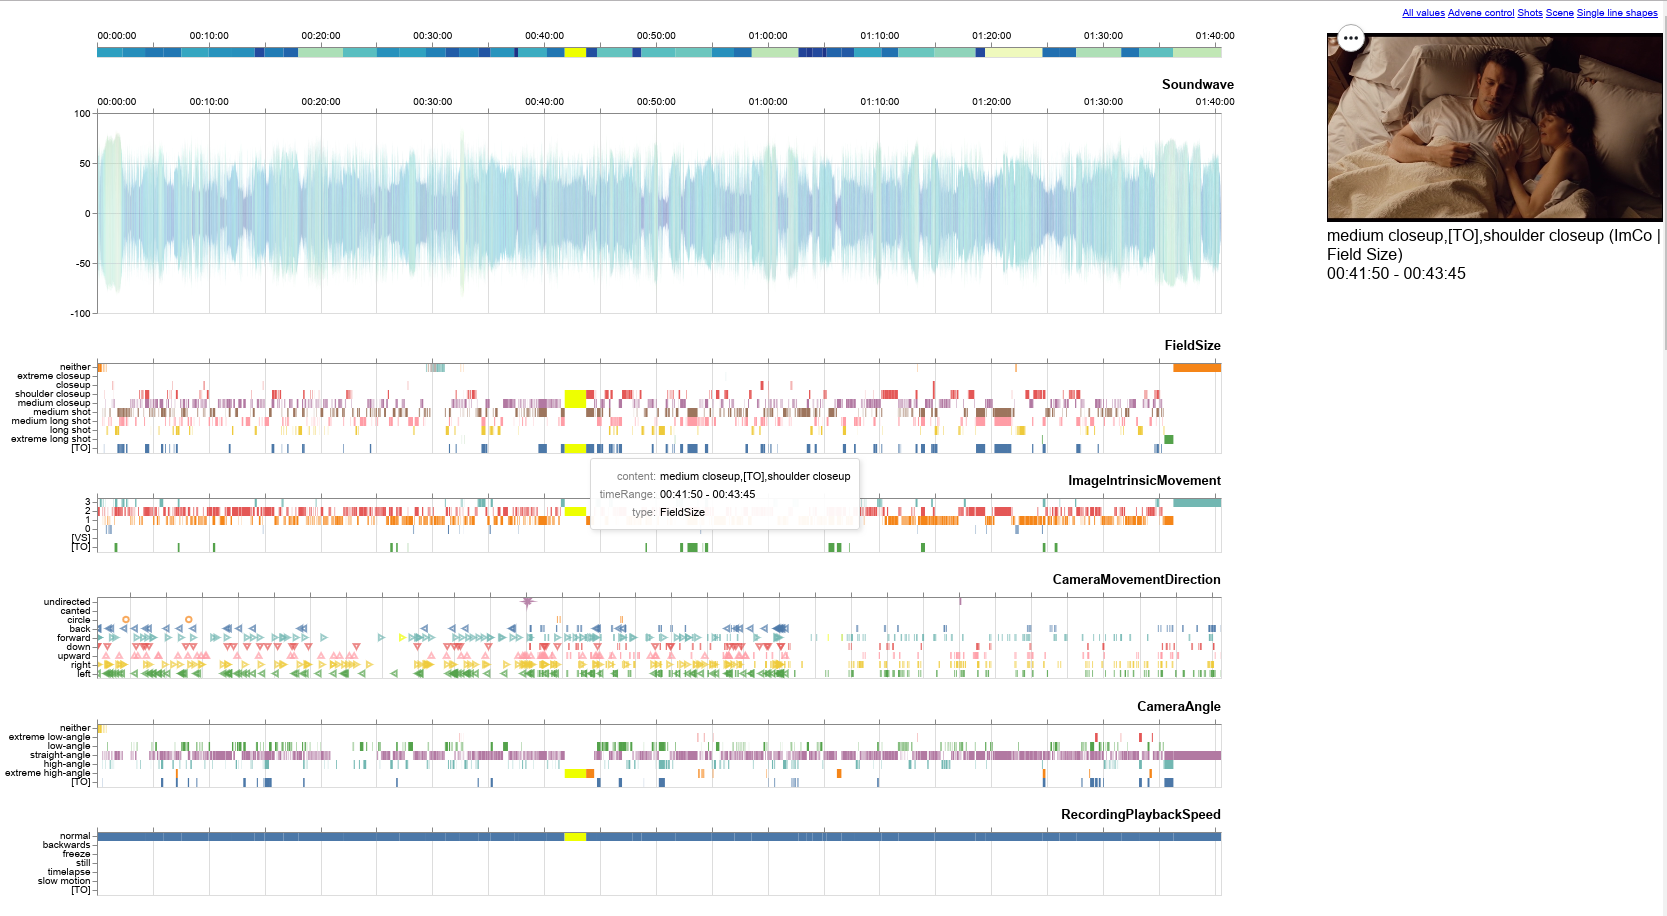
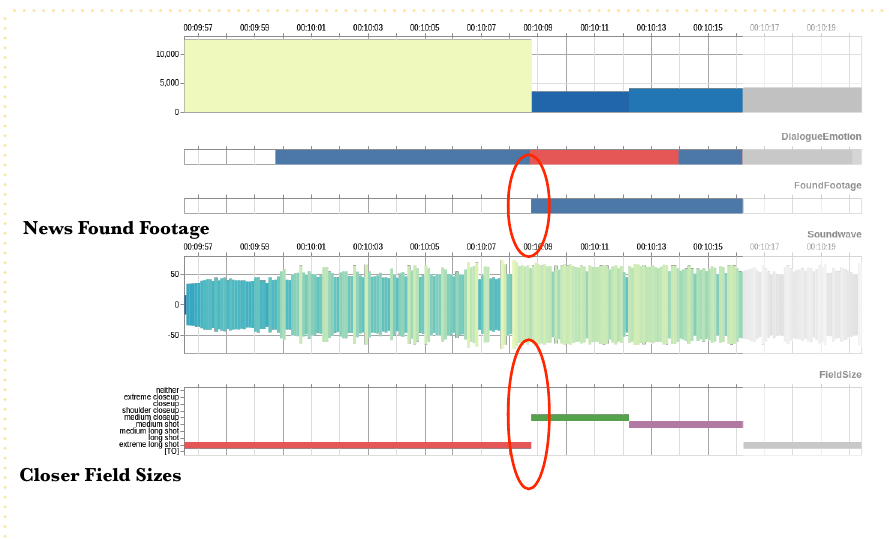
One possible visualisation, overview of annotations for one single movie
Storytelling examples
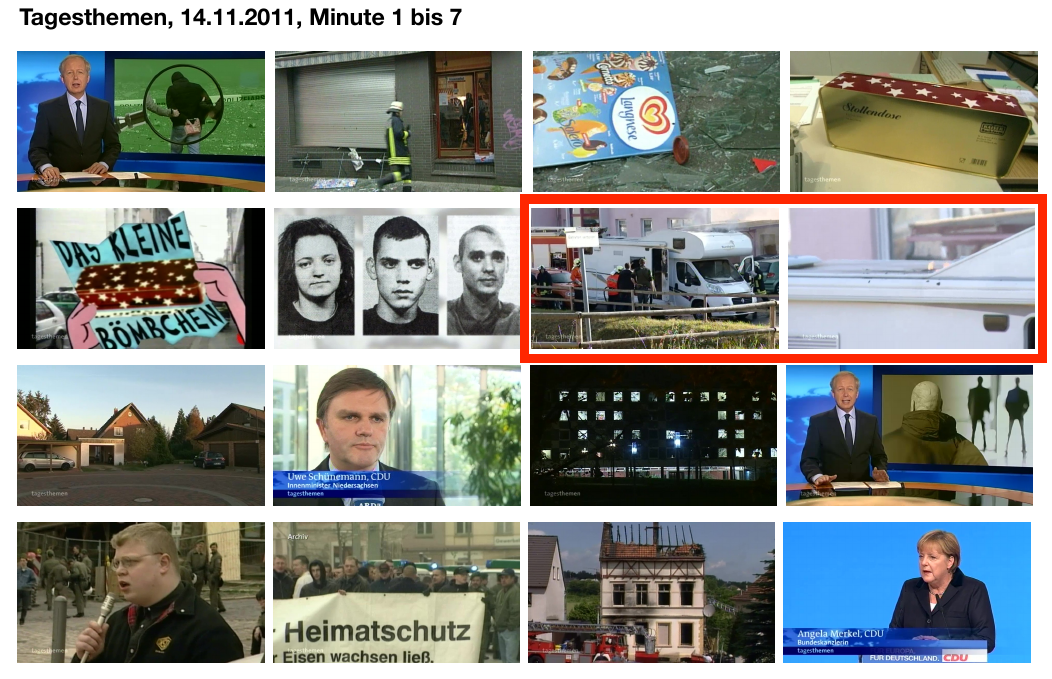
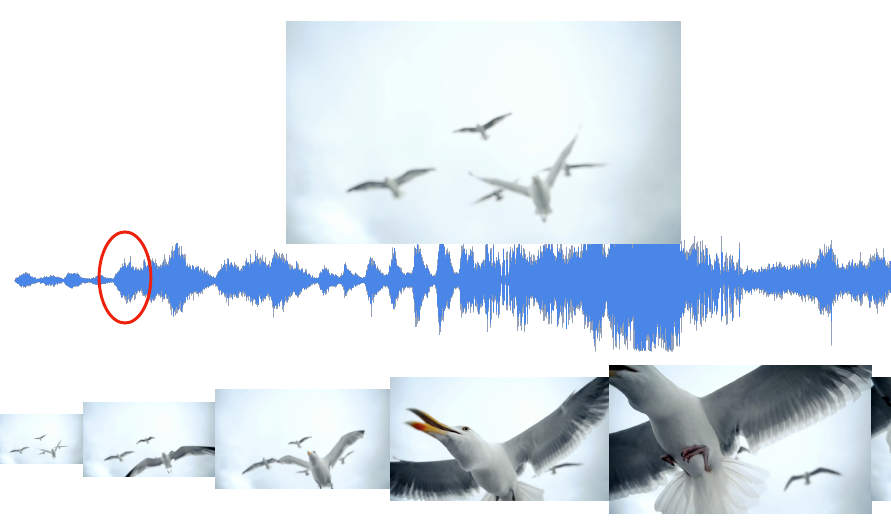
Illustrating thumbnails with some highlighted
Storytelling examples
Storytelling needs
- There are a number of practices for storytelling based on data
- What common features can be identified?
- In what measure some of them can be helped through instrumentation/tooling?
General data visualization
Systematic approach since XVIIIth century
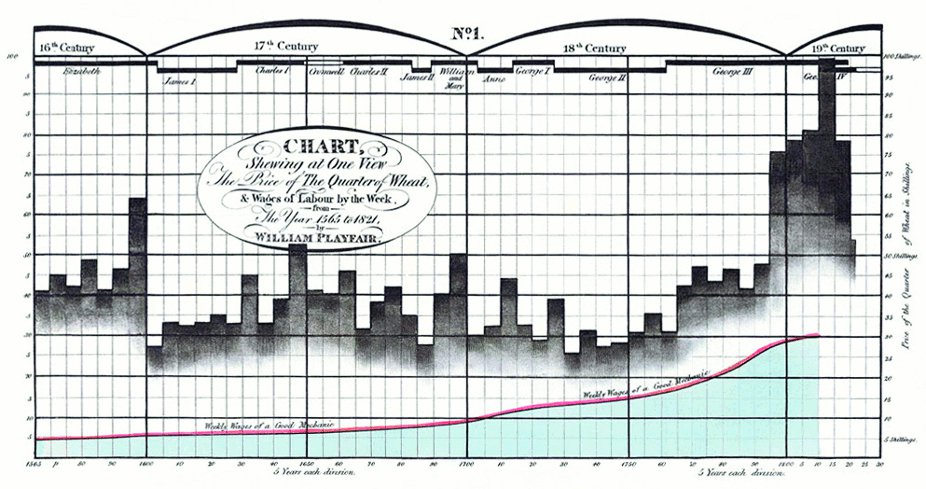
William Playfair (1821) - comparing price of wheat/bread and weekly wage
Sémiologie graphique
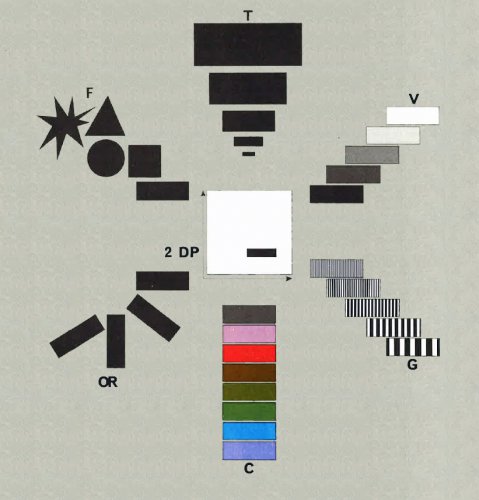
Identification of visual variables
Jacques Bertin (1967) - Sémiologie graphique (for cartography)
Sémiologie graphique 2
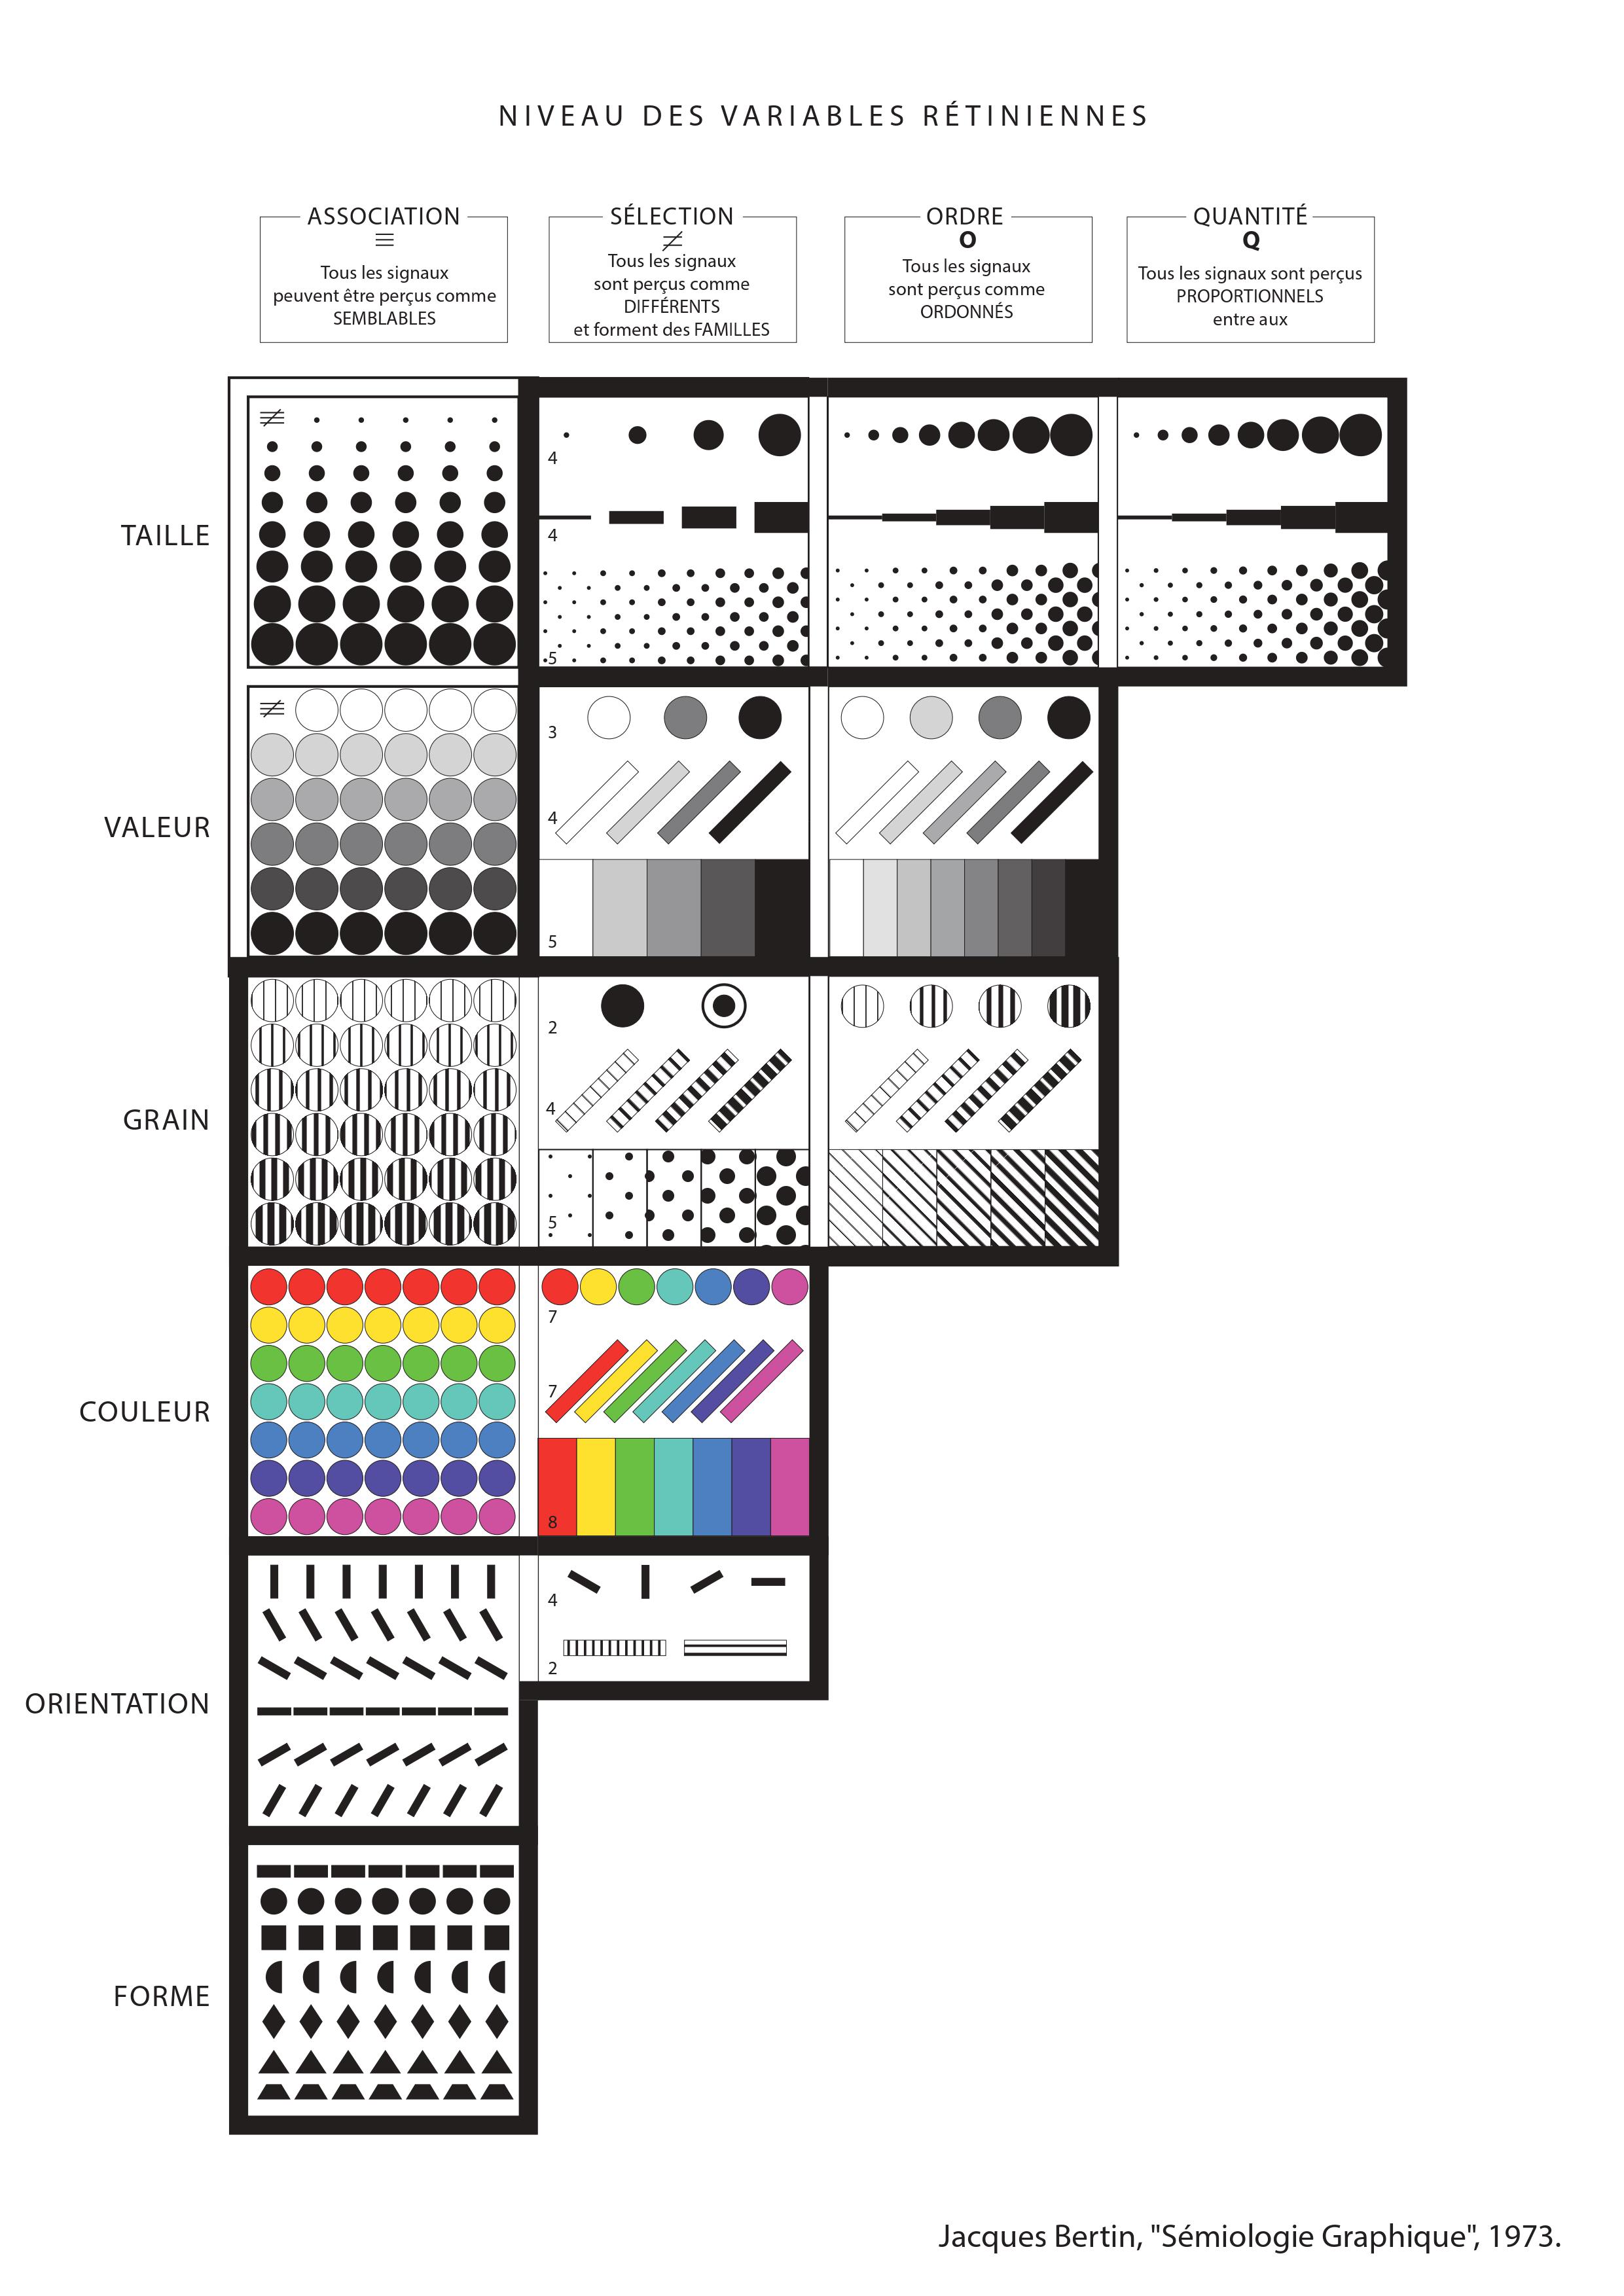
Classification of visual variables wrt. intended usage
Jacques Bertin (1967) - Sémiologie graphique (for cartography)
Other relevant references
The Visual Display of Quantitative Information (1983 - 2001) - Edward Tufte
Interactive Dynamics for Visual Analysis (2012) - Ben Shneiderman and Jeffrey Heer : taxonomy of tools for visualization and interaction
On a more technical level: Vega: interactive visualization grammar (used for current timeline visualisation)
Video annotation visualization
Movie specificities
- time
- sequence (Kuleshov effect)
- multimodality (time/image/audio/metadata)
- crossovers (video/audio)
Common representations
- Timelines
- Tables
- Transcripts
- …
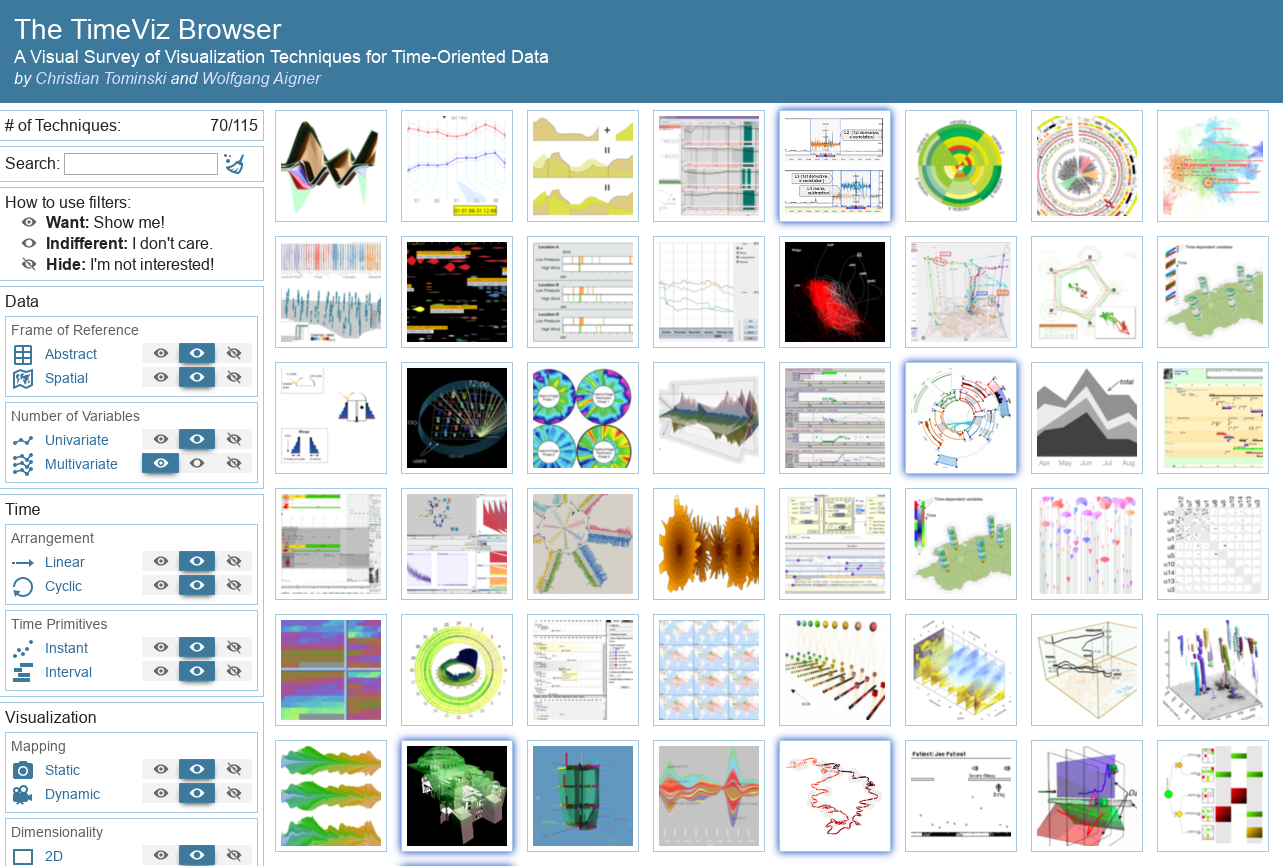
Alternative time representations
Visualization of Time-Oriented Data (2011) with companion website Timeviz browser Wolfgang Aigner, Silvia Miksch, Heidrun Schumann, Christian Tominsik
Possible inspirations
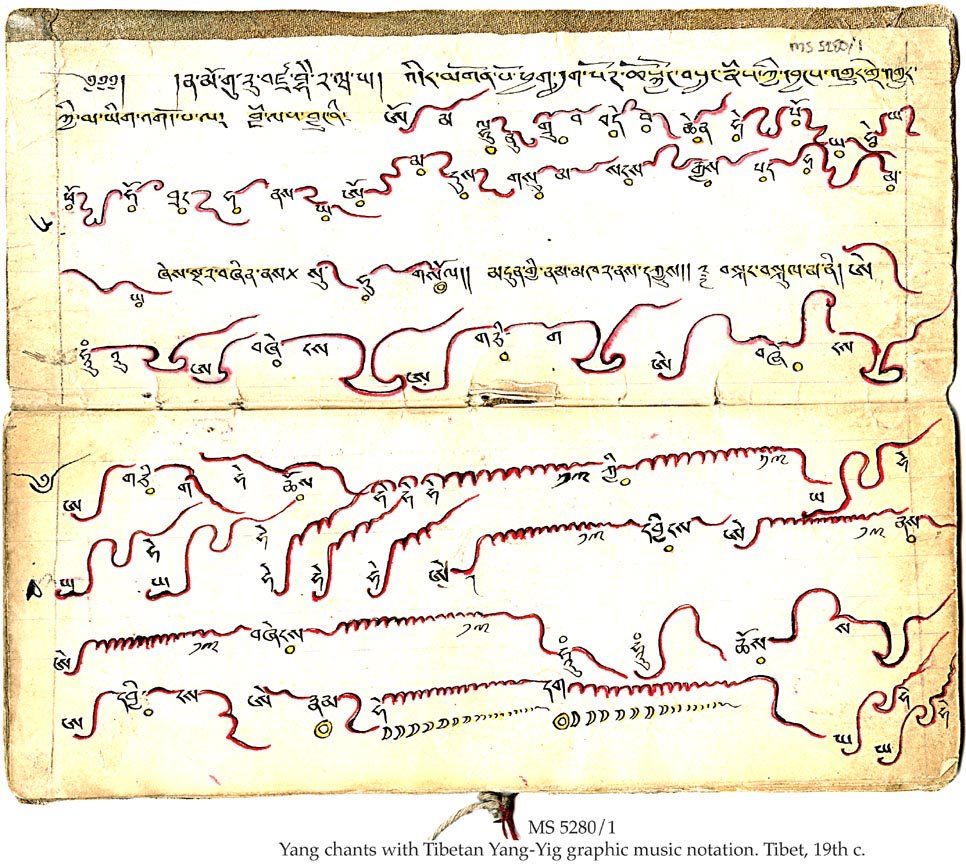
Other time-related domains: movies, music, dance…
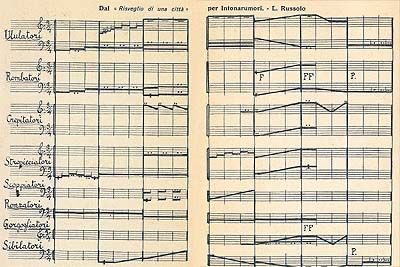
Movies
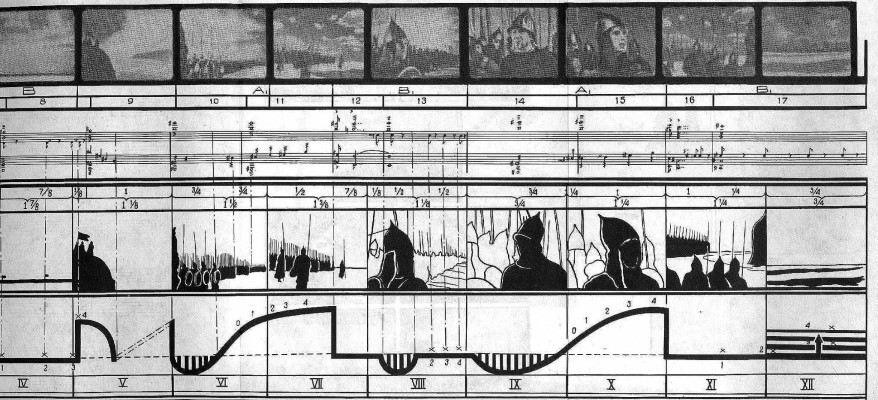
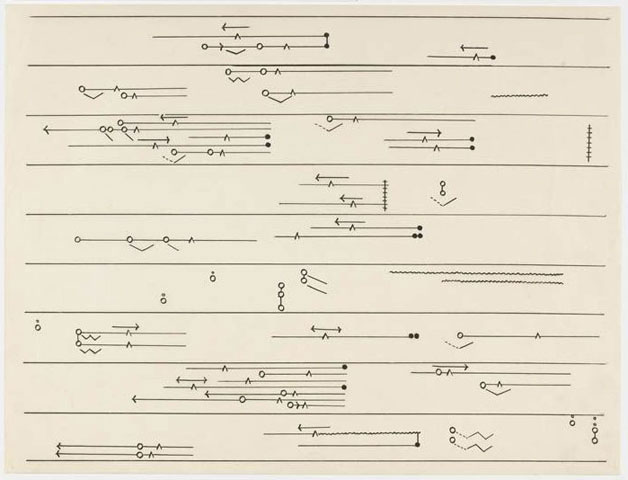
Eisenstein's diagram for Aleksandr Nevskii
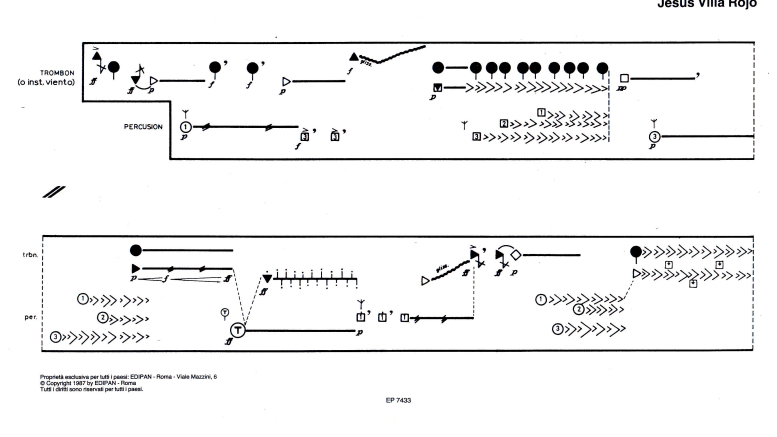
Music notation
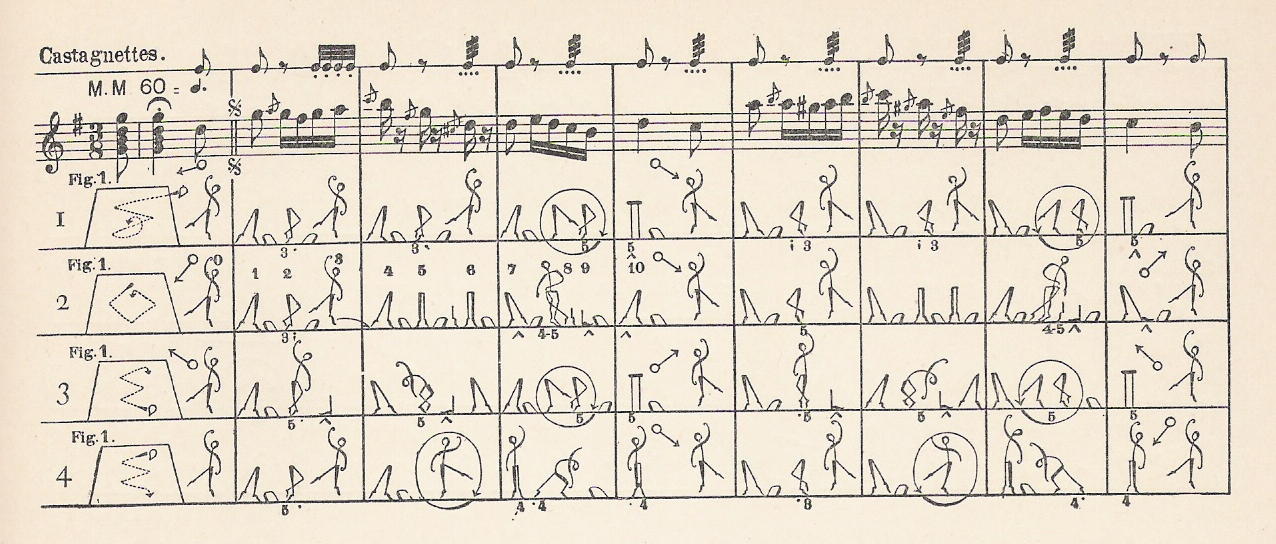
Dance notation
The original uploader was Huster at French Wikipedia. / CC BY-SA (http://creativecommons.org/licenses/by-sa/3.0/)
More formal dance notation
Labanotation
Inigolv / CC BY-SA (https://creativecommons.org/licenses/by-sa/4.0)
Other types of representations
- dynamic representations (Advene dynamic views, graphical overlays, montages…)
- sonification
- 3D/VR
- physical representation (3D print, sculpture, lego…)
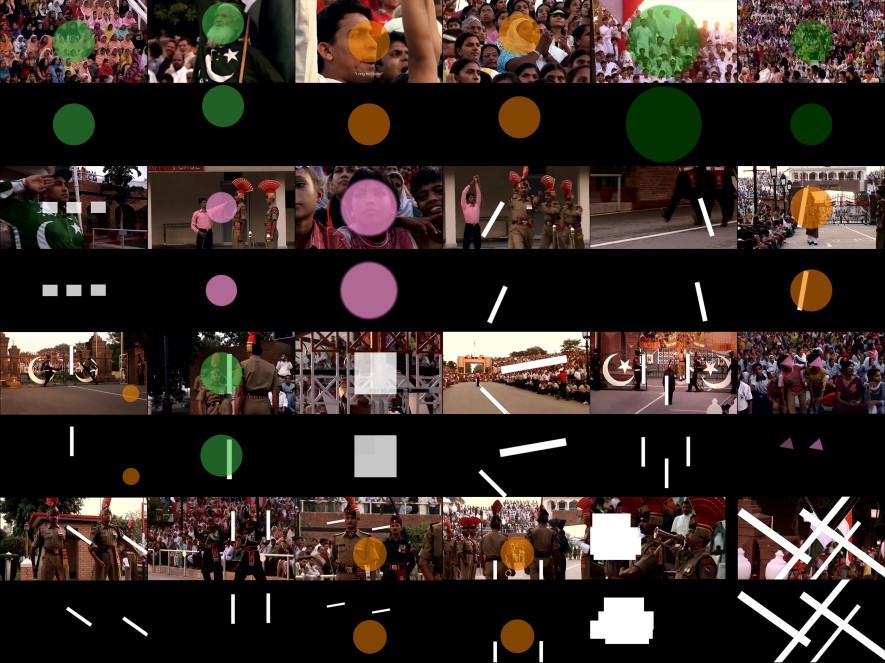
Dynamic representations
Szilvia Ruszev - Rhythmic Trajectories – Visualizing Cinematic Rhythm in Film Sequences
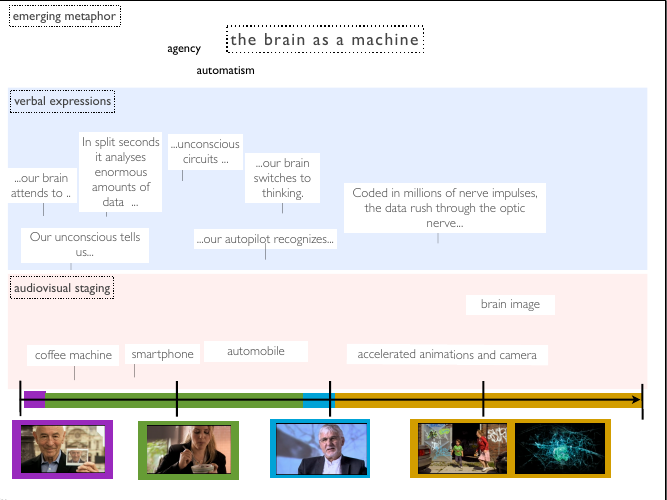
Annotations crafted for the representation
Wild ideas
Some wild ideas that I would like to explore:
- produce a video surrogate generated from annotation metadata (video and audio) and study in what measure this abstraction makes sense
- produce audio summaries to convert video annotations through fastened audio renderings of annotations
- study some physical representations (lego, 3d printing)
Storytelling
- Context of storytelling
- Support for presentations
- Website publication (autonomous reading)
Integrating storytelling into the workflow
- How can tooling be added to facilitate storytelling?
- How can it be integrated into currently used tools (Keynote, premiere)?
- Possible directions:
- Sozi for spatial storytelling: zooming presentation editor and player
- Scrollytelling (audio scrollytelling)
- Odyssey.js map-based storytelling
Sozi
Using sozi to animate a SVG graphics
To be continued…
This presentation constitutes preliminary ideas, that will evolve through interdiscplinary discussions.